
In e-commerce, response time is king. Regarding onsite search engines, response time tends to increase linearly with the number of products sold in an online shop. In a recent project, we enhanced a Solr search engine to overcome this barrier. We used the Prometheus Blackbox Exporter for progress validation (and regression detection).
Validate development progress
Before starting the project, we installed a Prometheus Blackbox Exporter instance. We configured Prometheus to query the onsite search with common problematic search terms (see below). We verified our progress with every deployment and proved stable response times during load tests.
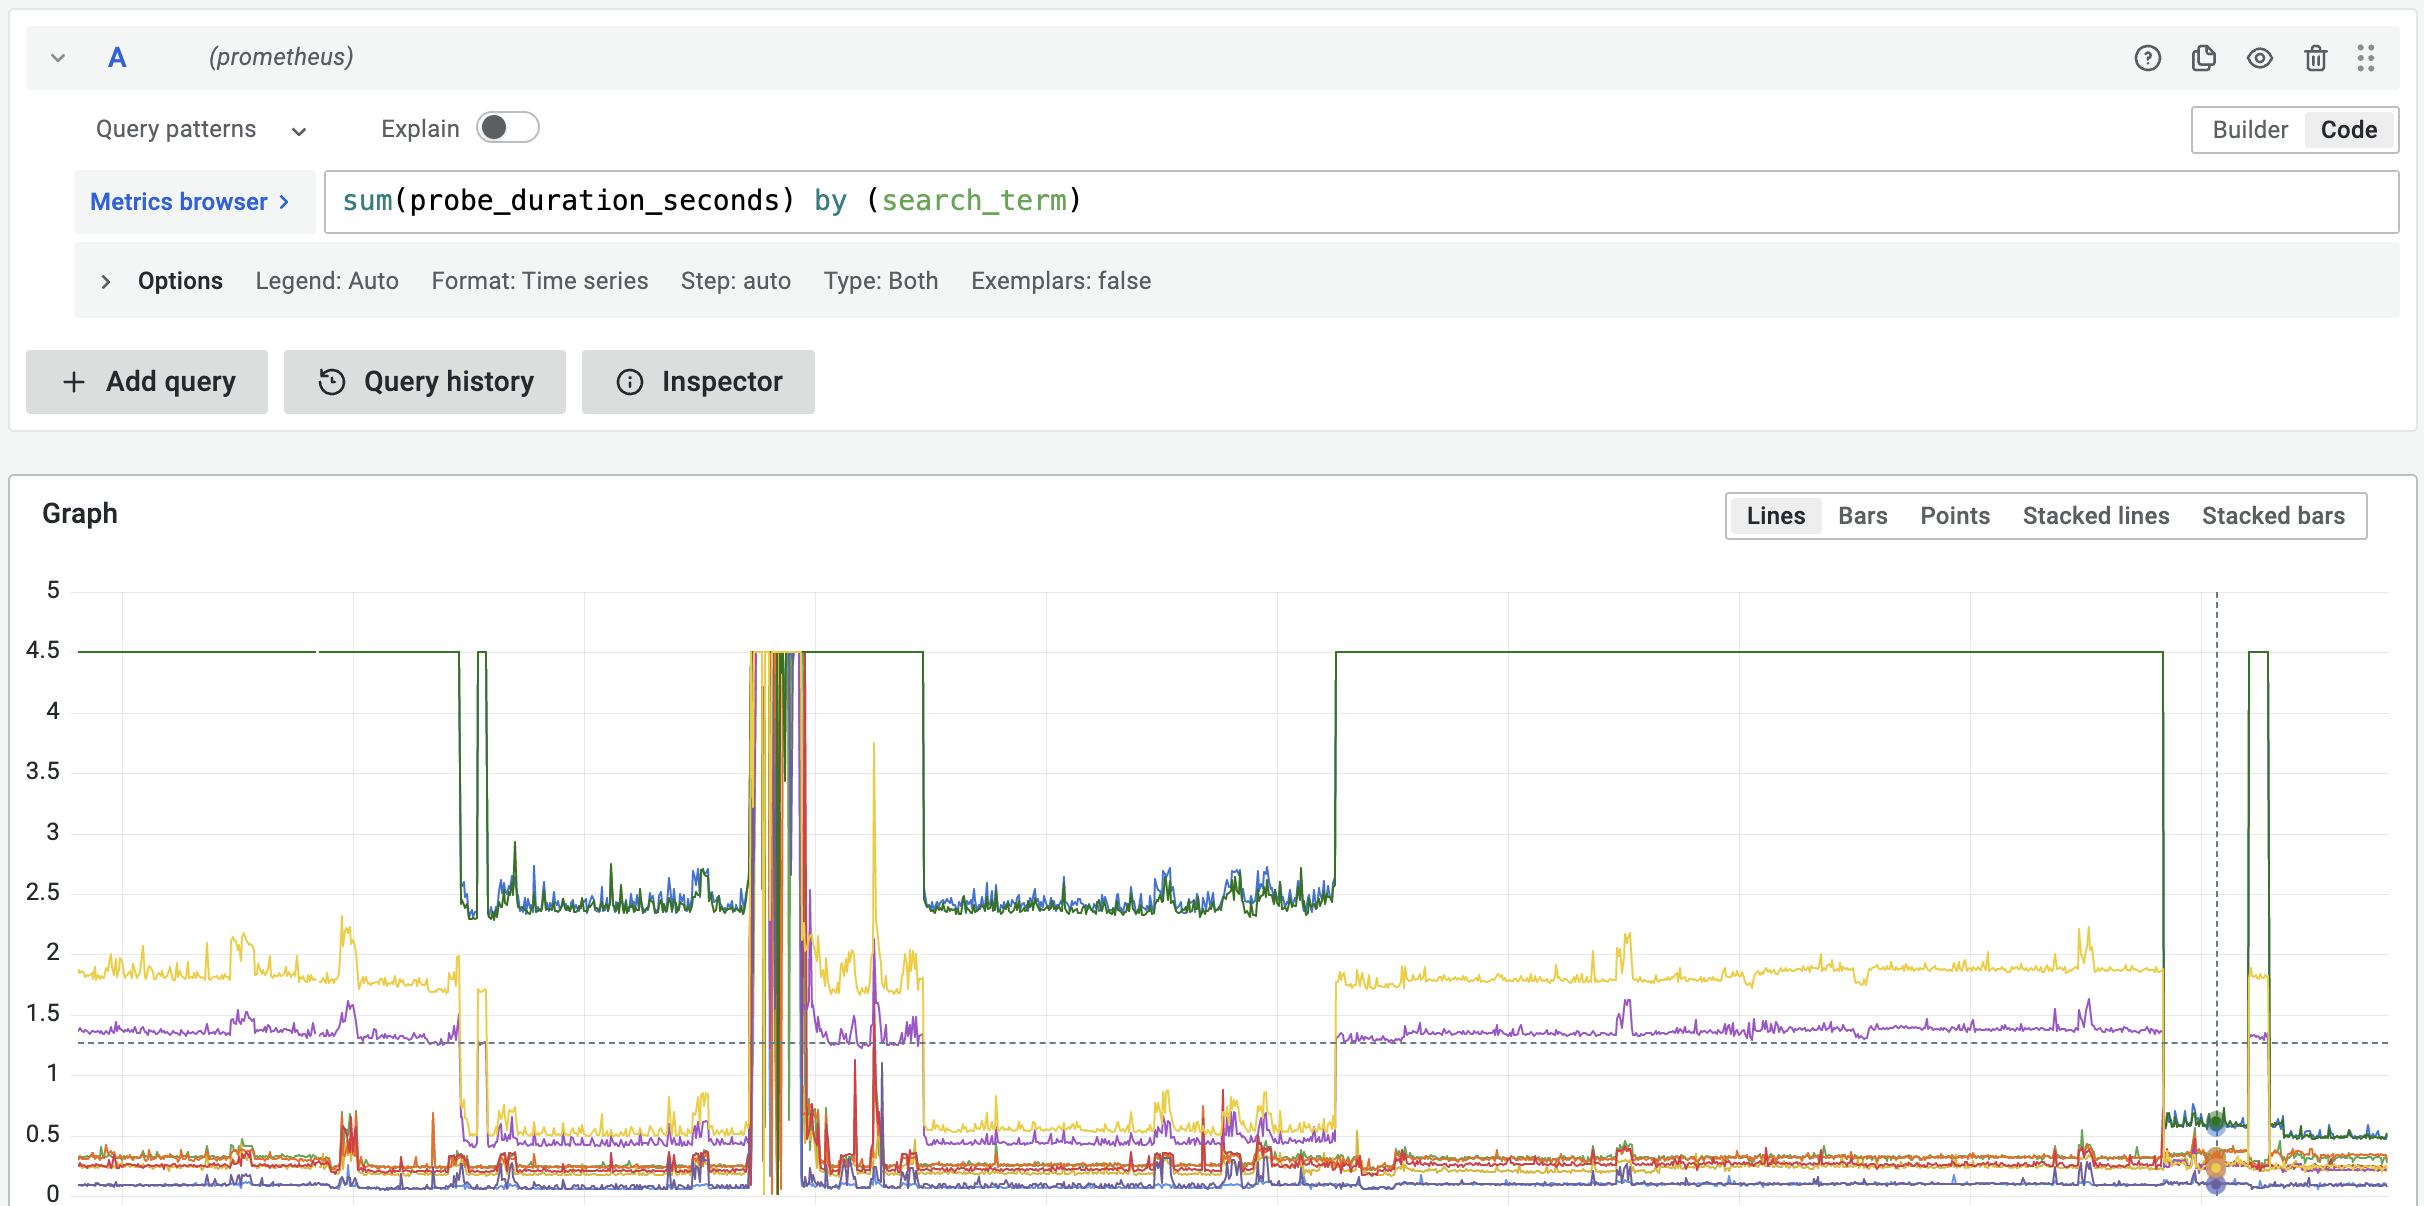
The screenshot below shows the progress we made for the search term sale (green line), where the response time dropped from 4.5s to 480ms over various iterations.
The Blackbox Exporter was the go-to tool for reporting our progress to management. 💪
Prometheus Blackbox Exporter
The Prometheus Blackbox Exporter is an open-source tool developed under the Prometheus umbrella. Once installed, it opens an HTTP port 9115 and exposes two metric paths
- The
/metricsendpoint returns metrics about the Blackbox Exporter running - The
/probeendpoint retrieves metrics from atargetsupplied as a request parameter.
The latter is the more interesting endpoint, allowing us to check multiple targets. Targets can be HTTP endpoints, but ICMP (Ping), DNS, or even raw TCP is also permitted (see the documentation for details). So, for now, we’ll focus on HTTP endpoints as targets.
The /probe endpoint accepts the following parameters:
target- the HTTP endpoint to check (e.g.https://ping7.io)module- the response check we want to conduct. OOTB, the Blackbox exporter comes with thehttp_2xxand thehttp_post_2xxmodule. Both check for a2xxHTTP response code and query the target via HTTPGETorPOSTrequest.debug- can be set totrueto retrieve debug information for the current probe.
You can verify your Blackbox Exporter installation by calling it via curl:
curl "http://localhost:9115/probe?target=https://ping7.io&module=http_2xx"
Integrate Blackbox Exporter into Prometheus
🌍 For the sake of simplicity, we’re using the ping7.io offering of hosted Prometheus Blackbox Exporters. Their service is free and gives us access to hosted Prometheus Blackbox Exporters in multiple data centers worldwide. It is a drop-in replacement for self-hosted Blackbox Exporters.
Using the magic of relabel_configs in Prometheus, you’re able to query multiple search terms in a single scrape job definition. In the example below, you list the search terms to query as targets. In the relabel_configs we append them to the target parameter and query the Blackbox Exporter for response time metrics for this specific search term.
In the example below, we query https://www.zalando.de/katalog/?q=schuhe as a first target for response times. After relabeling, the Prometheus is scraping the URL https://check.ping7.io/blackbox/probe?target=https://www.zalando.de/katalog/?q=schuhe&module=http_200 for metrics. And the best thing is: you can add as many search terms as you like.
Register with ping7.io for free and acquire an API token to get started. Save it into a ping7io-api-token file. Place it into Prometheus’ configuration directory (usually /etc/prometheus). Then, add the following scrape_job definition to your Prometheus configuration, restart, and check for metrics to appear.
scrape_configs:
- job_name: 'blackbox'
    metrics_path: /blackbox/probe
    scheme: https
    authorization:
      # Your ping7.io API token stored in this file
      credentials_file: ping7io-api-token
    params:
      module: [http_2xx]
      target: ["https://www.zalando.de/katalog/"]
    static_configs:
      - targets:
        - schuhe
        - hose
				- schwarz
				- sale
    relabel_configs:
      # store target as search_term
      - source_labels: [__address__]
        regex: '(.*)'
        target_label: search_term

      # build new target by concatenating
      # target param and static target config
      - source_labels: [__param_target, __address__]
        separator: "?q="
        target_label: __param_target

      # store new target as instance
      - source_labels: [__param_target]
        target_label: instance

      # use the ping7.io exporter endpoint
      - target_label: __address__
        replacement: check.ping7.io
Find this
docker-search-response-timesexample in the ping7.io examples GitHub project. Use the Docker Compose example to get a local Prometheus scraping response time metrics from the Zalando search up and running in seconds.
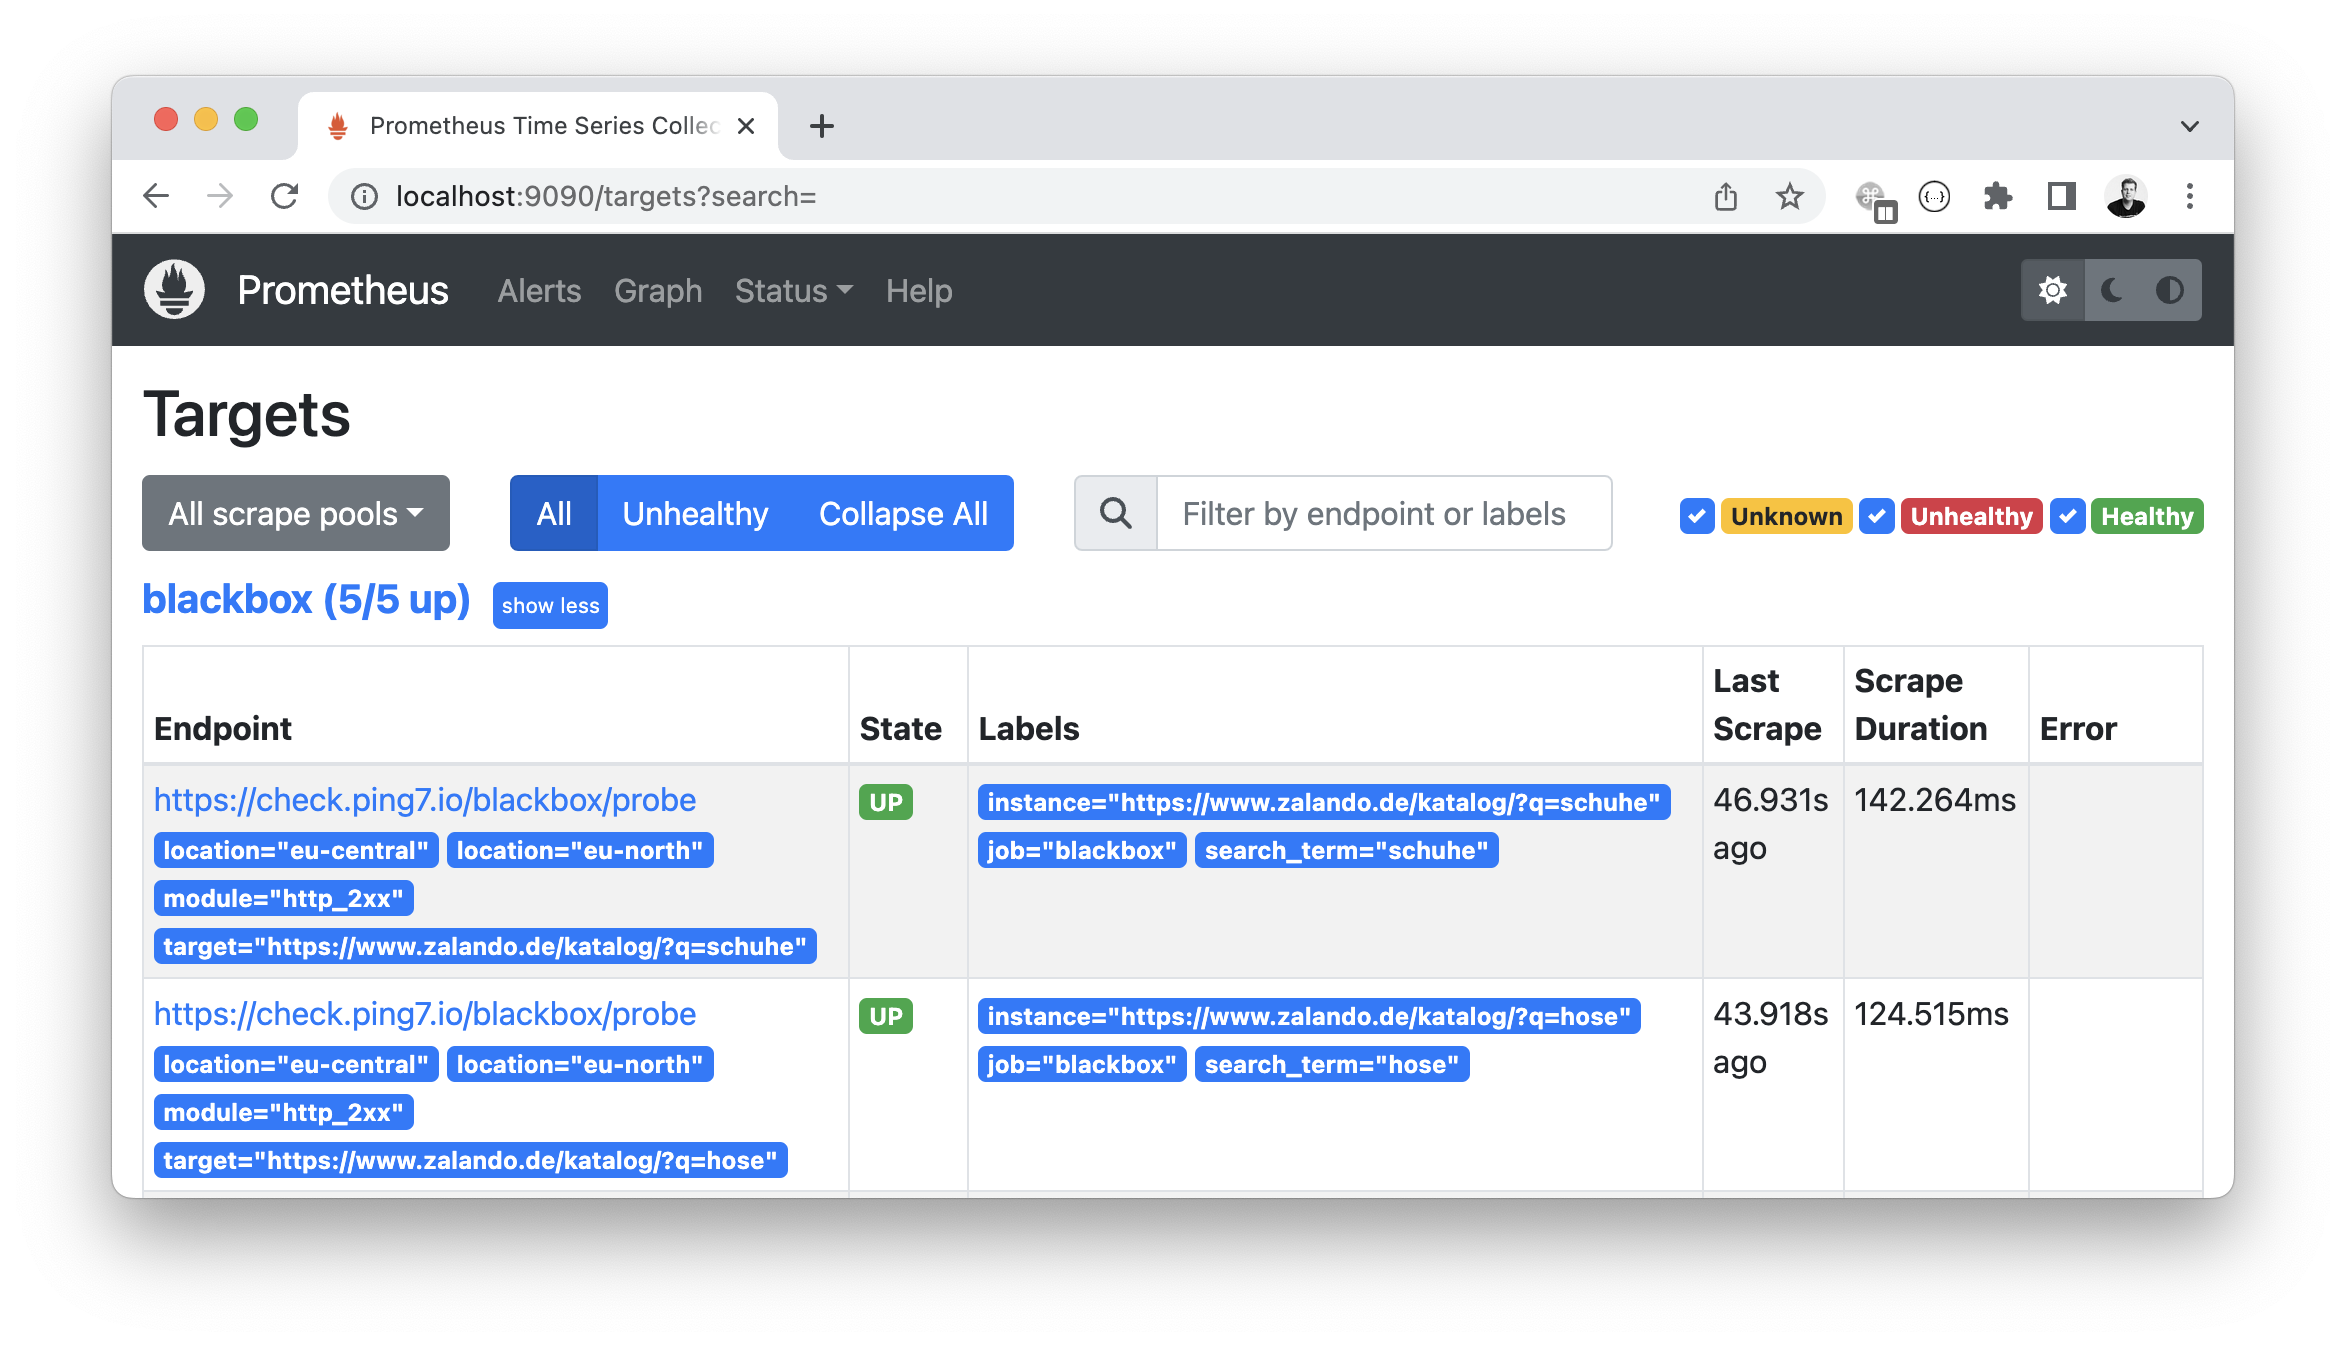
You can check the targets Prometheus is scraping in its web UI under Status -> Targets. You should find a blackbox pool appearing.
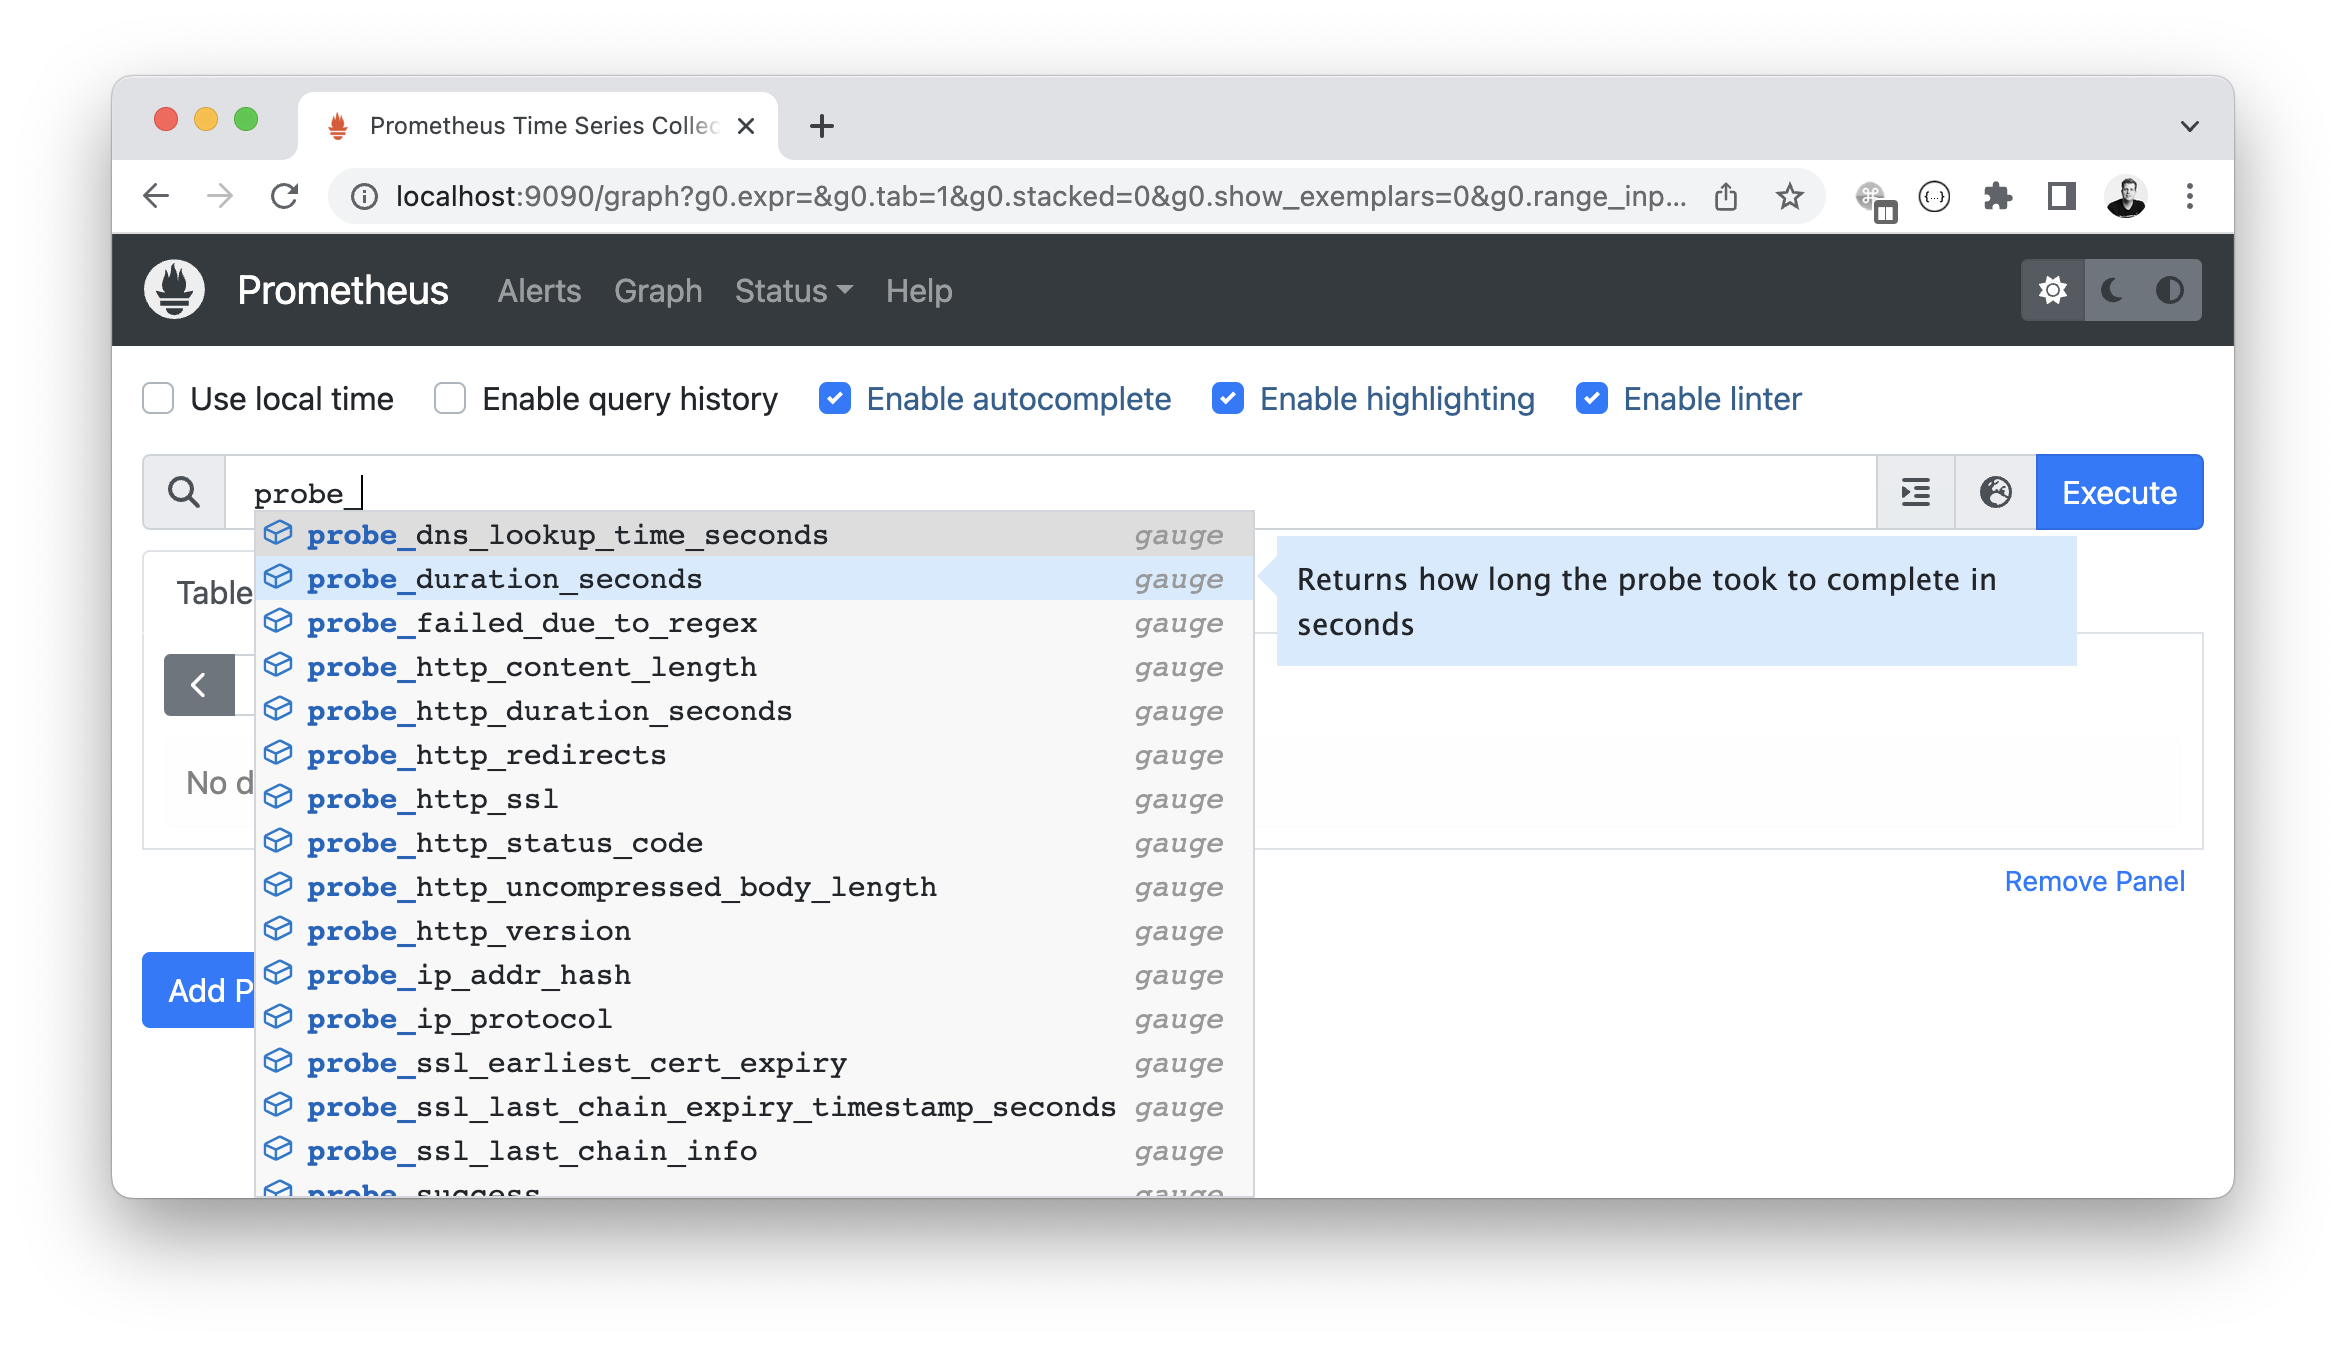
In the Prometheus web UI (or in Grafana Explore) you can check the available metrics.
Dig into the metrics available
Among the metrics exposed by the Blackbox Exporter the most interesting metrics response time wise are:
probe_duration_seconds- how long the probe took to complete in secondsprobe_duration_http_seconds- duration of the HTTP handshake and transfer process took to completeprobe_http_status_code- response HTTP status code
A query for probe_duration_seconds reveals metrics that are properly tagged with the search term and the location tested from. The example below reveals different response times depending on the location.
> probe_duration_seconds{search_term="damen"}
probe_duration_seconds{instance="https://www.zalando.de/katalog/?q=damen", job="blackbox", location="eu-central", search_term="damen"} 0.051105847
probe_duration_seconds{instance="https://www.zalando.de/katalog/?q=damen", job="blackbox", location="eu-north", search_term="damen"} 0.082042248
If we take a look at the details for the last probe coming out of the eu-north location, the probe_http_duration_seconds metric reveals, that the DNS resolve timing is quite high - compared to the overall request processing time.
> sum(probe_http_duration_seconds{search_term="damen", location="eu-north"}) by (phase)
{phase="connect"} 0.006571518
{phase="processing"} 0.030074424
{phase="resolve"} 0.025005933
{phase="tls"} 0.008122876
{phase="transfer"} 0.006751345
🔐 There’s more than these metrics to website response time.
Highly important are your TLS metrics as the TLS handshake and OCSP exchange have the potential to add response time to your application. ping7.io also offers the Prometheus SSL Exporter or the TLS Grade Exporter both rating your website’s TLS setup. For more information, check out istlsfastyet.com.
Alert on response time regressions
Well-tagged metrics are the foundation for actionable alerts. Thankfully there is a list of awesome Prometheus alerts available. Here is a collection of important Blackbox Exporter alerts.
Target is down
The target does not respond with a status code in the HTTP OK range? Fire this alert immediately. This alert will double-check that your deployments are truly non-disruptive.
- alert: BlackboxProbeHttpNotOk
  expr: probe_http_status_code > 299
  for: 0m
  labels:
    severity: critical
  annotations:
    summary: "Blackbox probe HTTP failure (instance {{ $labels.instance }})"
    description: "HTTP status code is not 200 OK"
Target is slow
For the Zalando search, we’re probing it safe to alert as soon as response times rise beyond 400ms. Your mileage may vary, so adapt the alert to your specific needs.
- alert: BlackboxSlowProbe
  expr: avg_over_time(probe_duration_seconds[5m]) > 0.4
  for: 0m
  labels:
    severity: info
  annotations:
    summary: Blackbox slow probe (instance {{ $labels.instance }})
    description: "Blackbox probe took more than 1s to complete"
You could even alert differently for specific, long-running search terms.
- alert: BlackboxSlowProbe
  expr: avg_over_time(probe_duration_seconds{search_term="sale"}[5m]) > 0.8
  for: 0m
  labels:
    severity: info
  annotations:
  summary: Blackbox slow probe (instance {{ $labels.instance }})
  description: "Blackbox probe took more than 1s to complete"
The TLS certificate is about to expire
This should not happen but you never know: if you forget to renew your ACME certificates, this alert comes in handy to prevent your website from not being accessible anymore.
- alert: BlackboxSslCertificateWillExpireSoon
  expr: probe_ssl_earliest_cert_expiry - time() < 86400 * 7
  for: 0m
  labels:
    severity: warning
  annotations:
    summary: Blackbox SSL certificate will expire soon (instance {{ $labels.instance }})
    description: "SSL certificate expires in 7 days"
Wrap up
The Prometheus Blackbox Exporter - hosted with ping7.io or not – is a useful extension to your Prometheus observability stack. It will reveal connectivity or deployment problems, and show progress in the development of your application. Add it to your Prometheus stack sooner than later!